Barkas:Isotopes and half-life.PNG
Menyang navigasi
Menyang panggolèkan
Gedhéning pratuduh iki: 518 × 599 piksel Résolusi liya: 207 × 240 piksel | 415 × 480 piksel | 640 × 740 piksel.
Berkas asli (640 × 740 piksel, ukuran barkas: 40 KB, jinis MIME: image/png)
Ringkesan
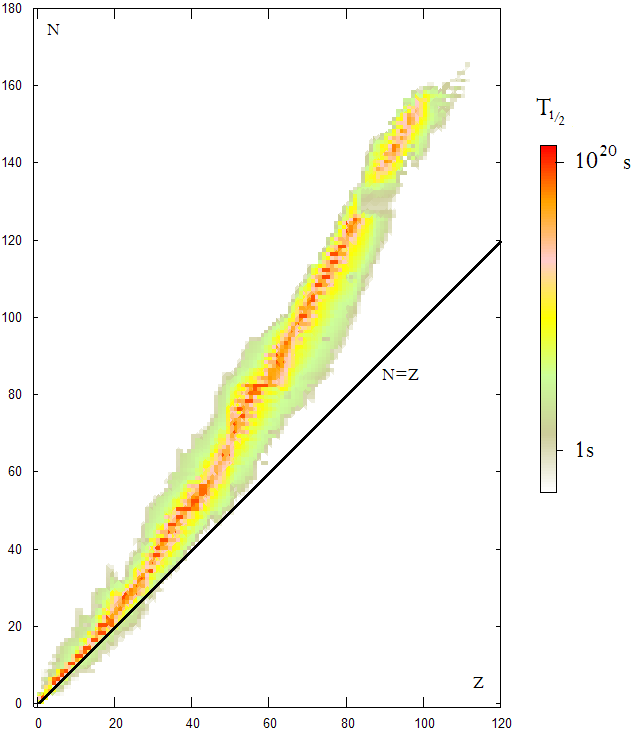
The Nuclear Chart which represent every known nucleus, stable and unstable. Plotted as Z (number of protons) versus N (number of neutrons). The color corresponds to the value of the half-life T½ with a strong log scale, as it varies between and seconds.


[]
SVG:
-
 Inggris
 -
 Esperanto
 -
 Walanda
 -
 Rusia
Rusia


PNG:
-
 Inggris
 -


Lisènsi
| Kula, sing nduwèni hak cipta karya iki, nerbitaké karya iki nèng domain umum. Iki kanggo nèng saubenging dunya. Nèng saperangan nagara iki mungkin ora dièntokaké; yèn mangkono: Kula ngawèhaké sapa waé hak migunakaké karya iki kanggo maksud apa waé, tanpa katemton apa waé, kajaba ana katemton kuwi dibutuhaké déning hukum. |
Sajarahing berkas
Klik ing tanggal/wektuné saprelu ndeleng rupané barkasé nalika tanggal iku.
| Tanggal/Wektu | Gambar cilik | Alang ujur | Naraguna | Tanggepan | |
|---|---|---|---|---|---|
| saiki | 19 Oktober 2006 21.50 | | 640 × 740 (40 KB) | wikimediacommons>Fffred~commonswiki | Graph of the stability of every known nucleus. Plotted as Z (number of protons) versus N (number of neutrons). The color corresponds to the value of the half-life <math>T_{1/2}</math> |
Panggunaning berkas
Ora ana kaca kang nganggo barkas iki.