Barkas:Correlation examples2.svg
Menyang navigasi
Menyang panggolèkan

Ukuran pratayang PNG ini dari berkas SVG ini: 506 × 231 piksel Résolusi liya: 320 × 146 piksel | 640 × 292 piksel | 1.024 × 467 piksel | 1.280 × 584 piksel | 2.560 × 1.169 piksel.
Berkas asli (Barkas SVG, nominal 506 × 231 piksel, gedhéning barkas: 2,18 MB)
Ringkesan
| Wedharan |
English: redesign File:Correlation_examples.png using vector graphics (SVG file) |
| Tanggal | |
| Sumber | Karya dhéwé, original uploader was Imagecreator |
| Juru pangarang | DenisBoigelot, original uploader was Imagecreator |
| Idin (Nganggo manèh bérkas iki) |
Released into the public domain (by the authors). |
| Vèrsi liya |
Derivative works of this file: CovrarianceCorrelation.svg File:Correlation_examples.png |
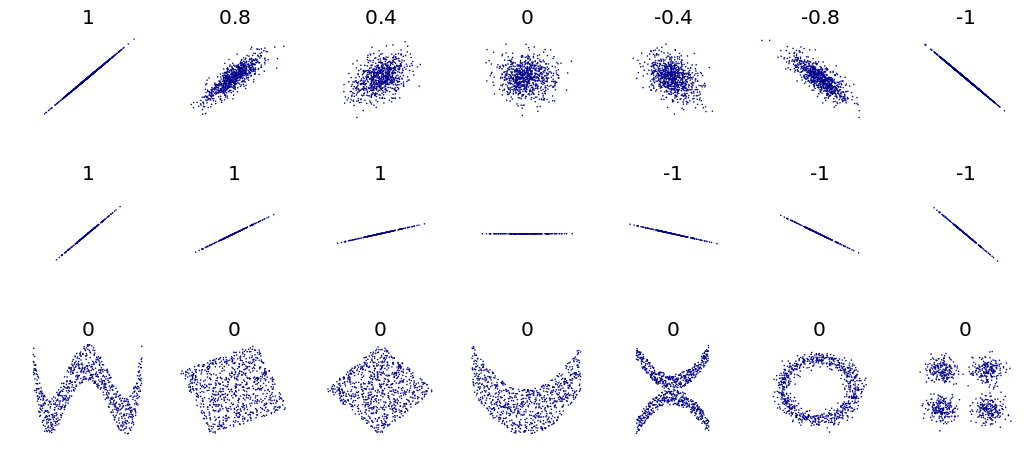
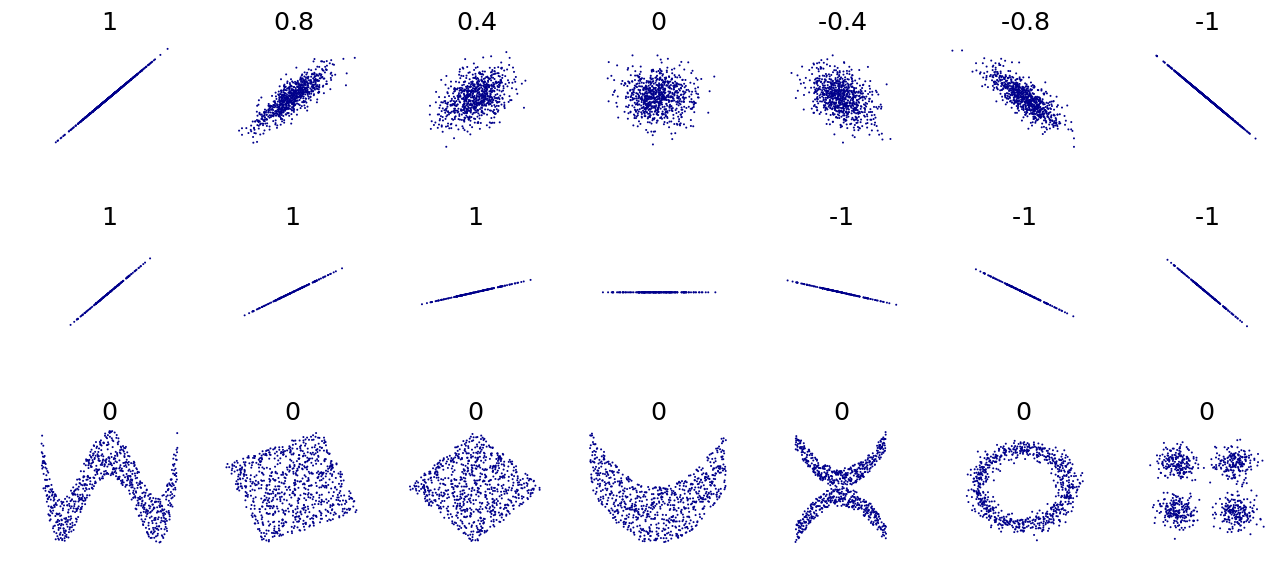
#Title: An example of the correlation of x and y for various distributions of (x,y) pairs
#Tags: Mathematics; Statistics; Correlation
#Author: Denis Boigelot
#Packets needed : mvtnorm (rmvnorm), RSVGTipsDevice (devSVGTips)
#How to use: output()
#
#This is an translated version in R of an Matematica 6 code by Imagecreator.

library(mvtnorm)
library(RSVGTipsDevice)

MyPlot <- function(xy, xlim = c(-4, 4), ylim = c(-4, 4), eps = 1e-15) {
   title = round(cor(xy[,1], xy[,2]), 1)
   if (sd(xy[,2]) < eps) title = "" # corr. coeff. is undefined
   plot(xy, main = title, xlab = "", ylab = "",
        col = "darkblue", pch = 16, cex = 0.2,
        xaxt = "n", yaxt = "n", bty = "n",
        xlim = xlim, ylim = ylim)
}

MvNormal <- function(n = 1000, cor = 0.8) {
   for (i in cor) {
      sd = matrix(c(1, i, i, 1), ncol = 2)
      x = rmvnorm(n, c(0, 0), sd)
      MyPlot(x)
   }
}

rotation <- function(t, X) return(X %*% matrix(c(cos(t), sin(t), -sin(t), cos(t)), ncol = 2))

RotNormal <- function(n = 1000, t = pi/2) {
   sd = matrix(c(1, 1, 1, 1), ncol = 2)
   x = rmvnorm(n, c(0, 0), sd)
   for (i in t)
      MyPlot(rotation(i, x))
}

Others <- function(n = 1000) {
   x = runif(n, -1, 1)
   y = 4 * (x^2 - 1/2)^2 + runif(n, -1, 1)/3
   MyPlot(cbind(x,y), xlim = c(-1, 1), ylim = c(-1/3, 1+1/3))

   y = runif(n, -1, 1)
   xy = rotation(-pi/8, cbind(x,y))
   lim = sqrt(2+sqrt(2)) / sqrt(2)
   MyPlot(xy, xlim = c(-lim, lim), ylim = c(-lim, lim))

   xy = rotation(-pi/8, xy)
   MyPlot(xy, xlim = c(-sqrt(2), sqrt(2)), ylim = c(-sqrt(2), sqrt(2)))

   y = 2*x^2 + runif(n, -1, 1)
   MyPlot(cbind(x,y), xlim = c(-1, 1), ylim = c(-1, 3))

   y = (x^2 + runif(n, 0, 1/2)) * sample(seq(-1, 1, 2), n, replace = TRUE)
   MyPlot(cbind(x,y), xlim = c(-1.5, 1.5), ylim = c(-1.5, 1.5))

   y = cos(x*pi) + rnorm(n, 0, 1/8)
   x = sin(x*pi) + rnorm(n, 0, 1/8)
   MyPlot(cbind(x,y), xlim = c(-1.5, 1.5), ylim = c(-1.5, 1.5))

   xy1 = rmvnorm(n/4, c( 3,  3))
   xy2 = rmvnorm(n/4, c(-3,  3))
   xy3 = rmvnorm(n/4, c(-3, -3))
   xy4 = rmvnorm(n/4, c( 3, -3))
   MyPlot(rbind(xy1, xy2, xy3, xy4), xlim = c(-3-4, 3+4), ylim = c(-3-4, 3+4))
}

output <- function() {
   devSVGTips(width = 7, height = 3.2) # remove first and last line for no svg exporting
   par(mfrow = c(3, 7), oma = c(0,0,0,0), mar=c(2,2,2,0))
   MvNormal(800, c(1.0, 0.8, 0.4, 0.0, -0.4, -0.8, -1.0));
   RotNormal(200, c(0, pi/12, pi/6, pi/4, pi/2-pi/6, pi/2-pi/12, pi/2));
   Others(800)
   dev.off() # remove first and last line for no svg exporting
}
Lisènsi
Kula, sing nduwèni hak cipta karya iki, mawa iki nerbitaké berkas iki sakisoré lisènsi kasebut:
| Berkas ini dilepaskan di bawah CC0 1.0 Dedikasi Domain Publik Universal Creative Commons. | |
| Orang yang mengaitkan suatu karya dengan dokumen ini telah mendedikasikan karyanya sebagai domain publik dengan mengabaikan semua hak ciptanya di seluruh dunia menurut hukum hak cipta, termasuk semua hak yang terkait dan berhubungan, sejauh yang diakui hukum. Anda dapat menyalin, menyebarkan, dan mempertunjukkan karya, bahkan untuk tujuan komersial, tanpa meminta izin.
|
Sajarahing berkas
Klik ing tanggal/wektuné saprelu ndeleng rupané barkasé nalika tanggal iku.
| Tanggal/Wektu | Gambar cilik | Alang ujur | Naraguna | Tanggepan | |
|---|---|---|---|---|---|
| saiki | 10 Mèi 2011 07.00 | | 506 × 231 (2,18 MB) | wikimediacommons>DenisBoigelot | {{Information |Description ={{en|1=fd}} |Source ={{own}} |Author =DenisBoigelot |Date = |Permission = |other_versions = }} fjdk |
Panggunaning berkas
Kaca ing ngisor iki nganggo barkas iki: